yDrink
The total package for your on-premise needs in Texas.
Search by Product
Identify the top accounts for your product and drill down by unique SKU's to see where they could be doing better.
Drill Down to Accounts
Search for specific accounts or filter by county, city, or zip. See the top regions for your brands + demographic information.
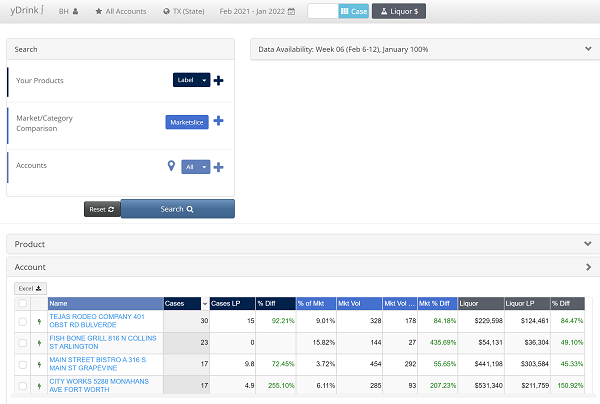
Excel & Graphs
All reports are fully exportable to Excel and data can be further manipulated. Our custom graphs allow you to visualize the data in a way that allows you to see the entire marketplace in one glance.
Analyze History & Trends
See historical data all the way back to 2012. See a month to month comparison of your products at specific accounts. Gain valuable insight into your sales data for better understanding and forecasting.
An Integral tool for the Texas on-premise alcohol market
Contains 3 data sets: Brand, Marketslice, and Consumer Spend
Monthly Data Analysis
Our interface is designed for local reps to use as monthly evaluations of your brands shipments into the on-premise for sales and market evaluations.
Customize Groups
Create custom groups to meet your needs and easily track your brands in specific accounts.
Interactive and Exportable Graphs
Visualize your data with our comprehensive graphs. Easily compare your brands to the market as whole.
Location Based Data for Mobile Users
Mobile compatible and designed to use when out in the field. No need to ever walk into an account blind.